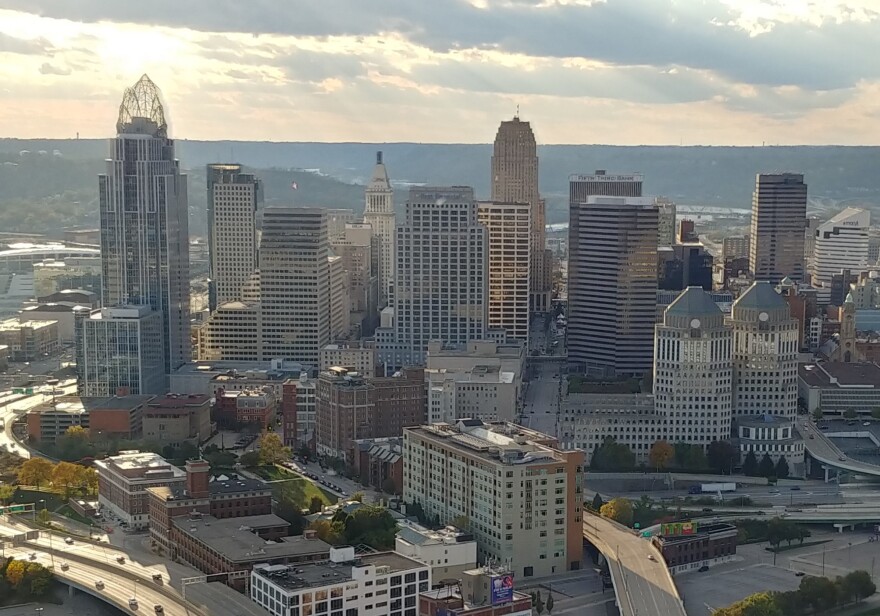
With another mid-week heat blast coming, residents are doing all they can to stay cool. It’s easier for some than others, according to University of Cincinnati’s Design, Architecture, Art and Planning Associate Professor Pravin Bhiwapurkar.
Bhiwapurkar studies how urban development contributes to the heat island (UHI) effect. He got a fully funded Ph.d. fellowship researching this, and since then has been trying to help cities and communities experiencing higher heat. UHI affects building energy needs, microenvironments and human health — especially older populations and the very young.
What causes the temperatures to rise Downtown?
“Their heat exposure is much higher there because of the low tree canopy cover, high impervious surfaces, to also the community proximity to the freeways and industrial areas, which can also transport a lot of heat to that area,” says Bhiwapurkar. Black roofs and heat created by building air conditioning units also are contributing factors.
Bhiwapurkar began working with UC in 2015 and credits the current administration, as well as previous ones, for taking steps to cool things down. WVXU’s Becca Costello reported on a climate change public hearing in Bond Hill last month.
He also appreciates the work organizations like Groundwork Ohio River Valley and Green Umbrella, with its equitable climate solutions plan, are doing. Here is one example on WVXU’s Cincinnati Edition.
Other solutions
Bhiwapurkar recommends “opening more cool centers in the communities where people can access those buildings with air conditioners; some water misters at bus stops and some public spaces. Socially, there is a neighborhood watch program where people can watch (check-in) with their friends, families and relatives.”
The city of Cincinnati says it is committed to addressing extreme heat. On its Environmental and Sustainability (OES) page, it says it organized community volunteers to collect heat data on August 10, 2020, using heat/humidity sensors attached to vehicles. The study also included additional jurisdictions: Elmwood Place, Lincoln Heights, Norwood and St. Bernard.
OES received the results of this campaign in late October 2020. Read the Heat Watch Cincinnati report here.


